Guider
How to read a LEGO price chart (and never overpay again)
A current price means little on its own. Learn to read a set's price history — all-time low, RRP discipline, retailer spread and timing — and buying well becomes routine.
Skriven av Brickheist-teamet · Publicerad 11.07.2026
A price tag tells you what a set costs today. It tells you nothing about whether that is a good price. The same LEGO set can be a bargain one month and poor value the next — same box, same pieces, very different deal. The tool that turns a naked price into an informed decision is the price history chart, and reading one properly takes about a minute once you know what to look for.
Start with the all-time low
The single most useful number on a price chart is the lowest price the set has ever sold for among the retailers being tracked. It is your benchmark for what the market has actually been willing to offer — not a theoretical discount, a real one that happened.
- Current price at or near the all-time low: historically, this is as good as it gets. If you want the set, this is a buy signal.
- Current price well above the all-time low: the market has done better before, and unless the set is nearly out of production, it often will again. Waiting has a decent expected payoff.
- A new all-time low on an older set: pay attention — deep late-life lows often mean retailers are clearing stock, which can be both the best price the set will ever have and one of the last chances to get it at retail.
Anchor everything to the RRP
Every set has a recommended retail price, and it is your defence against manufactured discounts. A shop can raise its own price and then "cut" it, producing an impressive-looking saving against a number nobody ever paid. The RRP does not play that game. Discipline means one habit: judge a discount against the RRP and the price history, never against a retailer's own crossed-out price. If the chart shows the set has spent most of its life below today's "offer", the offer is noise.
The flip side also matters: some sets almost never drop meaningfully below RRP — typically exclusives and sets sold through few channels. For those, the chart will show a flat line, and waiting for a big discount is waiting for something the data says rarely happens. The chart tells you which kind of set you are looking at.
Read the spread across retailers
At any given moment, a set is usually available from several retailers at different prices — and the gap between the cheapest and the most expensive can be substantial. That spread is information:
- A wide spread means comparing is doing real work for you — the cheapest offer is genuinely unusual, and buying from the wrong shop is genuinely expensive.
- A narrow spread means the market agrees on the price, and your energy is better spent on timing than on shopping around.
- One retailer far below the rest is often a clearance or a short campaign — the kind of price that disappears when stock does.
This is also why a price chart built from many retailers beats memory or a single shop's history: it shows the best available price at each point in time, across the market in your region.
Look for the timing patterns
LEGO prices move in loose but recognisable seasonal waves. Discounting typically intensifies around major sale events in late autumn, post-holiday clearances early in the year, and mid-year sales, with quieter stretches in between. Individual sets also have their own rhythms — some go on offer regularly, others almost never. The chart makes both visible: a set with frequent dips rewards patience; a set with a flat history does not. If you are buying for a fixed date — a birthday, a holiday — start watching well in advance so you can buy on a dip instead of paying whatever the calendar forces on you.
Let the tools do the watching
Reading charts is a skill; checking them daily is a chore. Two features remove the chore:
- Price alerts. Set a target price on a set you are watching and get notified when a tracked retailer drops to it. This is the practical answer to "the price is not quite there yet".
- Heist Score. Our deal score from 0 to 100 condenses the chart-reading above — discount depth, price history context and more — into a single number, so you can rank current offers by how good they actually are rather than how loudly they are advertised. It is the shortcut; the chart is the full picture.
If you just want today's strongest offers surfaced for you, the deals page lists them, and applying the checklist above to anything on it takes moments: near the all-time low? Real discount against RRP? Cheapest retailer in the spread?
Putting it together
The full routine: check the current price against the all-time low, verify the discount against RRP rather than a crossed-out price, scan the retailer spread for a better offer, and glance at the set's own history to judge whether waiting is likely to pay. Here is that routine's raw material — City sets at the current best tracked prices in your region:

City
Fire Rescue Helicopter
0,96 kr/st
City
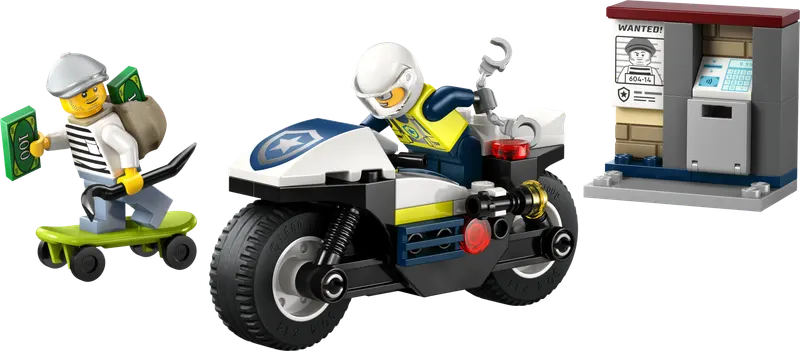
Police Motorcycle Chase
1,83 kr/st

City
Rides - Police Truck
1,69 kr/st

City
Rides - Fire Truck
1,79 kr/st

City
Police Car
1,28 kr/st

City
Rides - Construction Loader
1,97 kr/st

City
Go-Karts and Race Drivers
1,21 kr/st

City
Rides - Gaming Race Car
1,87 kr/st
One minute per set. That is the entire discipline — and it is the difference between paying the asking price and paying the right price.